
Klaviyo
The project as a whole: The team had just six months to conceptualize, design, develop, and deliver a new product for Klaviyo—the Customer Data Platform (CDP). Operating with a lean team, we also faced the challenge of rapidly launching a comprehensive set of features within the CDP, later called "Intelligence," offering advanced analytics to appeal to upmarket customers. I was the sole designer responsible for the entire Intelligence feature set, shaping its user experience and ensuring it met the high standards of enterprise clients.
Role: Senior Product Designer (with iterations as Lead Product Designer)
Skills for this case study: Visual design, prototyping, wireframes, user research, design strategy, design systems thinking
Launching the Klaviyo CDP Intelligence feature set
The team had just six months to conceptualize, design, develop, and deliver a new product for Klaviyo—the Customer Data Platform (CDP). Operating with a lean team, we also faced the challenge of rapidly launching a comprehensive set of features within the CDP, later called "Intelligence," offering advanced analytics to appeal to upmarket customers, where I was the sole designer. The CDP launch was coordinated as part of key market messaging preceding Klaviyo’s IPO.
We reached first year revenue targets within eight months. The features were so successful it split out as a standalone product. Since then it has exceeded revenue goals month over month for almost two quarters.
A new way to analyze purchase behavior
RFM analysis (Recency, Frequency, and Monetary Analysis) was a relatively standard form of analyzing purchase behavior that competitors were offering that was not possible within the Klaviyo product. As part of the CDP Intelligence suite of features (aimed at reaching parity to competitors to entice upmarket customers), and RFM quickly became the feature with the most complexity and the most potential to add value.
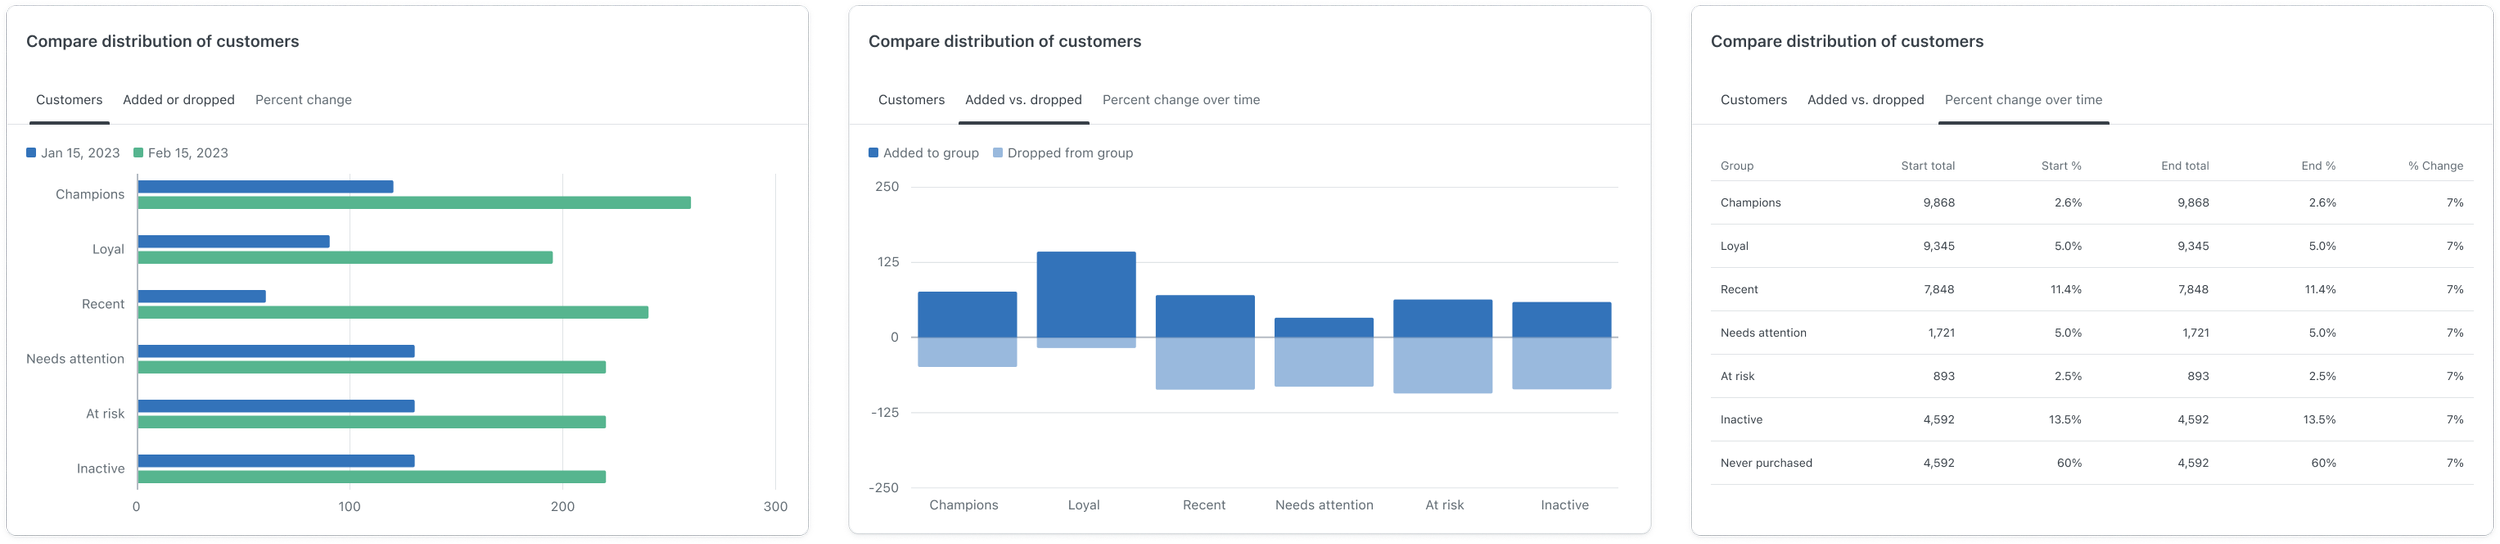
When designing, we focused on allowing customers to see the data split in multiple ways in context with other data, rather than infinitely stacking charts and data tables. This lead to a tab approach for customer distribution data to clearly show change over time.
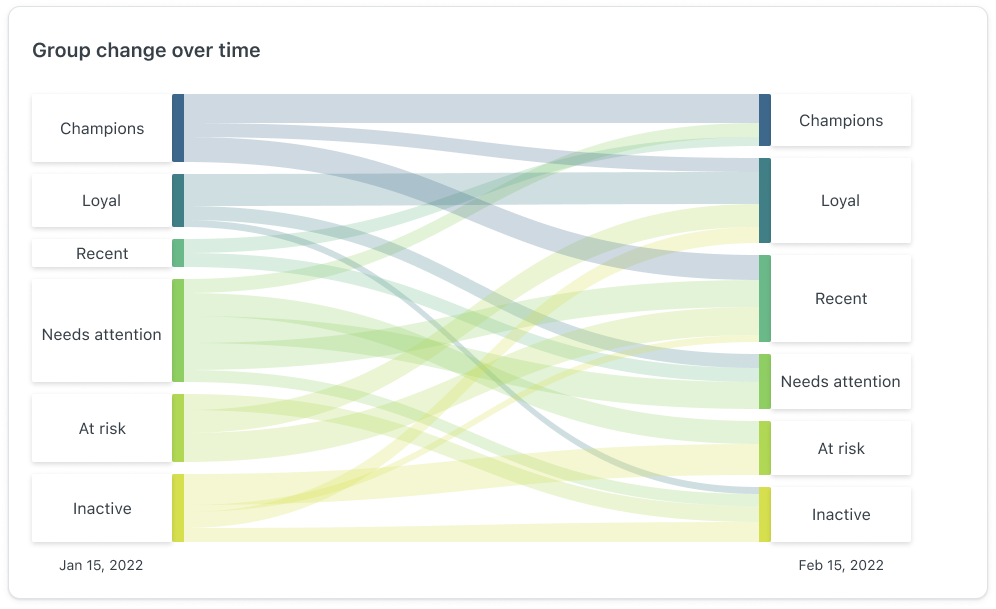
The sankey diagram (pictured above), was an especially challenging aspect of this feature. Used by competitors, this was not something within the existing Klaviyo design system for data visualization and was a significant lift given the tight timeframe for the project. However, we were able to validate with users how essential this visualization was for users to see the movement of their customers between groups over a time period, work with teams and key stakeholders to get the work prioritized and include the sankey chart in the initial release.
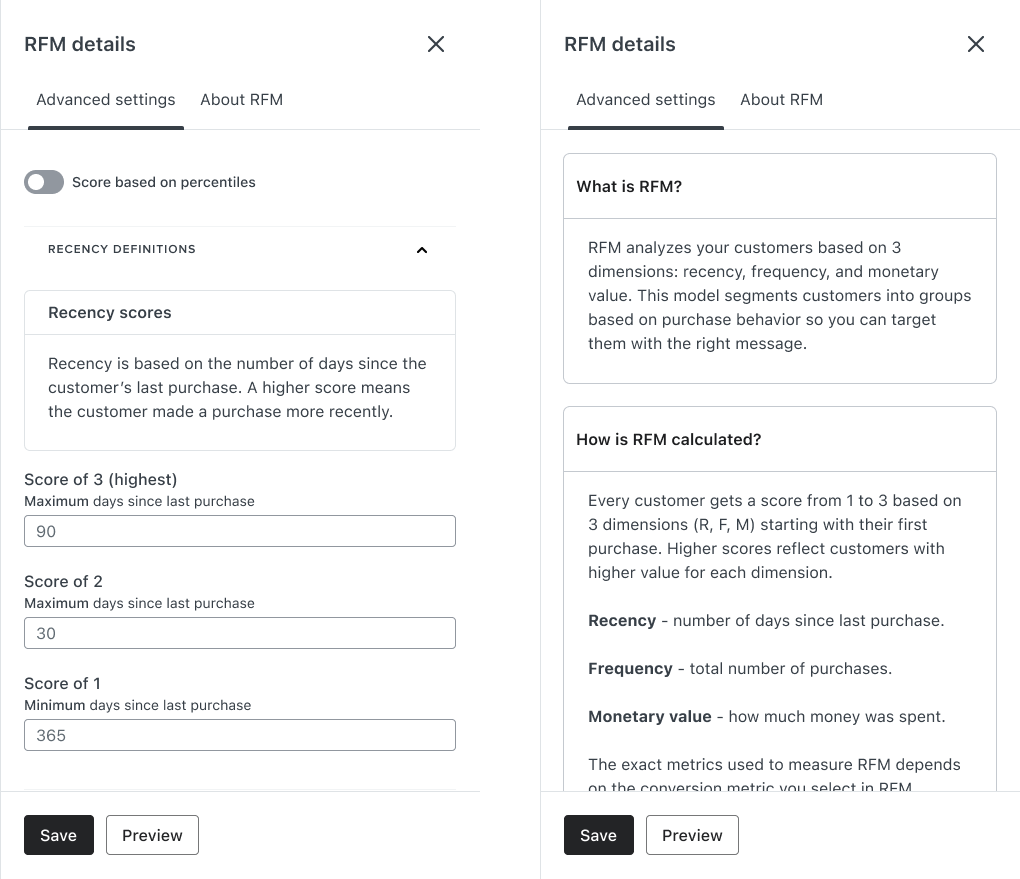
In addition, we new from user testing that the potential CDP customer valued the ability to customize their settings to tailor their data analysis to their business and also wanted to understand how everything was calculated by Klaviyo before trusting the numbers provided. To solve for this, we implimented an extensive settings drawer. The settings tab allowed customers to view the way the matrix of RFM groups were created by percentiles or raw values, pre-filled with Klaviyo recommended perameters that were editable by the user. Above each section the user could see definitions and guidance for the scoring for Recency, Frequency, and Monetary Value. There was an additional about tab that walked customers through the feature without sending them to help article which was a typical friction point for customers elsewhere in the app.
Making funnels more valuable
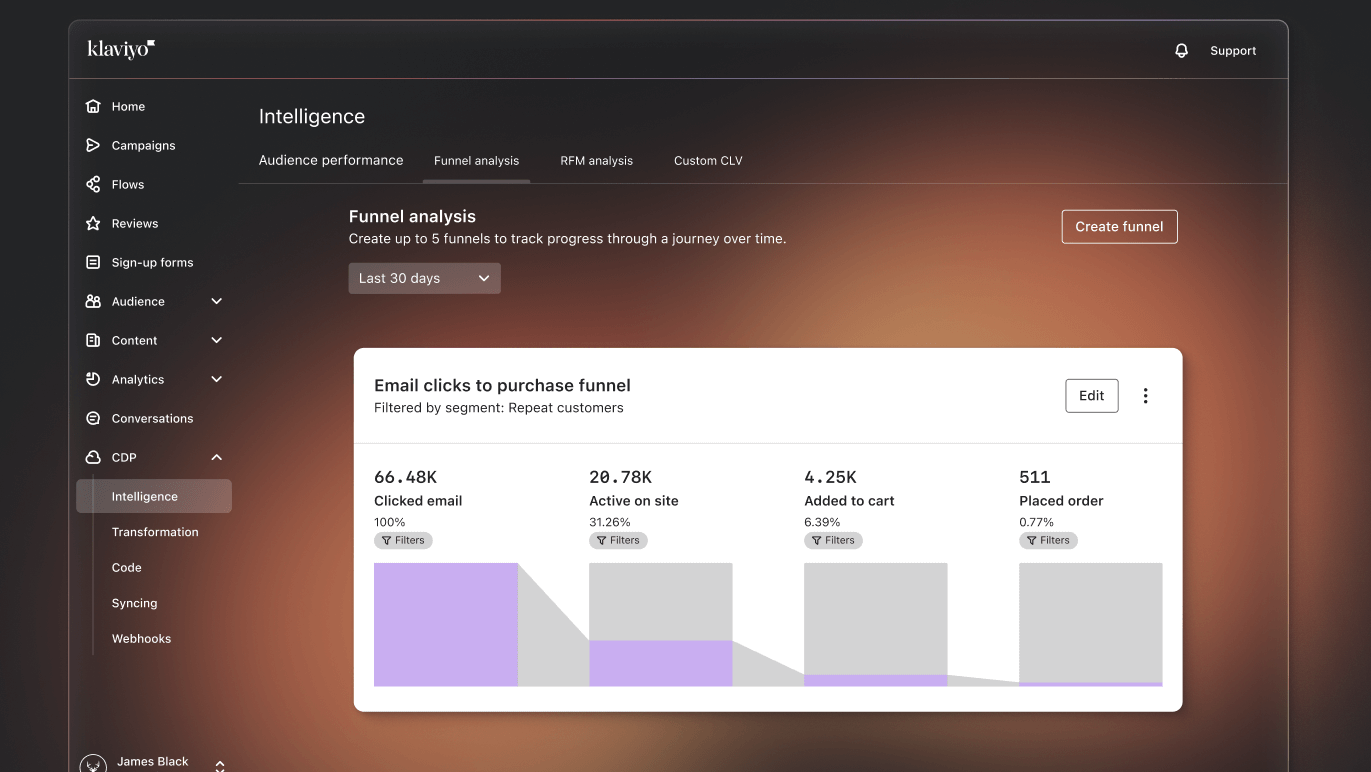
Funnels in Klaviyo were buried within the dashboards and held little flexibility for customers. As part of the CDP Intelligence features, we set out to build a more robust funnel feature that was customizable and easy to use.
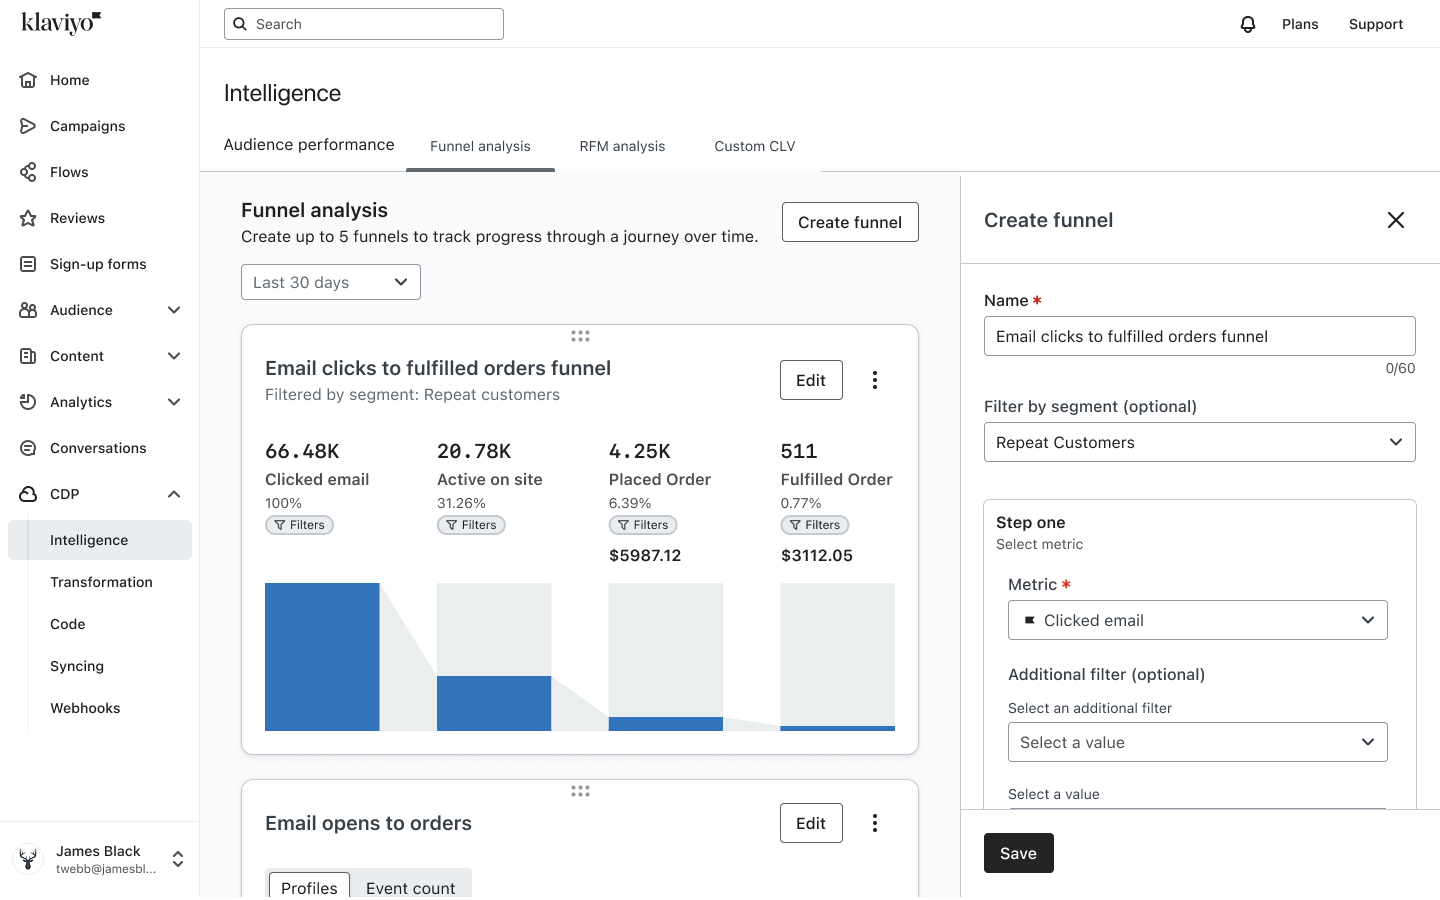
To keep consistency in mind across all the features and address the customization needs of the funnel builder, we used a drawer much like in the RFM settings. This allowed users to see any previous funnels they had created as users often mentioned creating “versions” of similar funnels to compare to one another. This same drawer also allowed users to edit an existing funnel and see the funnel while making edits.
We heavily relied on user testing to determine what data was most essential to customers above each step of the funnel, and this lead to iterations around the percentages listed (there was confusion around the percent from the previous step vs the percent from the first step). Additionally, we incorporated the ability for users to filter their funnels by segment, a key need in order to drill down to certain customer types when analyzing a funnel path.
So successful, it became its own product
After the launch of the Klaviyo CDP, the Intelligence suite I designed (RFM Analysis, Funnel Analysis, Custom CLV, and Audience Performance) were key selling points in closing deals for customers. The main feedback was around actionability which we knew when user testing the MVP. The features gave helpful insights that customers weren’t getting but now they wanted to do something with this information and that still felt disconnected. We learned early on that creating segments from RFM groups would unlock significant value. I was able to capture this feedback and celebrate our initial success just in time to go give birth to my son. While on maternity leave, the team was able to ship the Action Center, giving customers the start of the actionability they were asking for.
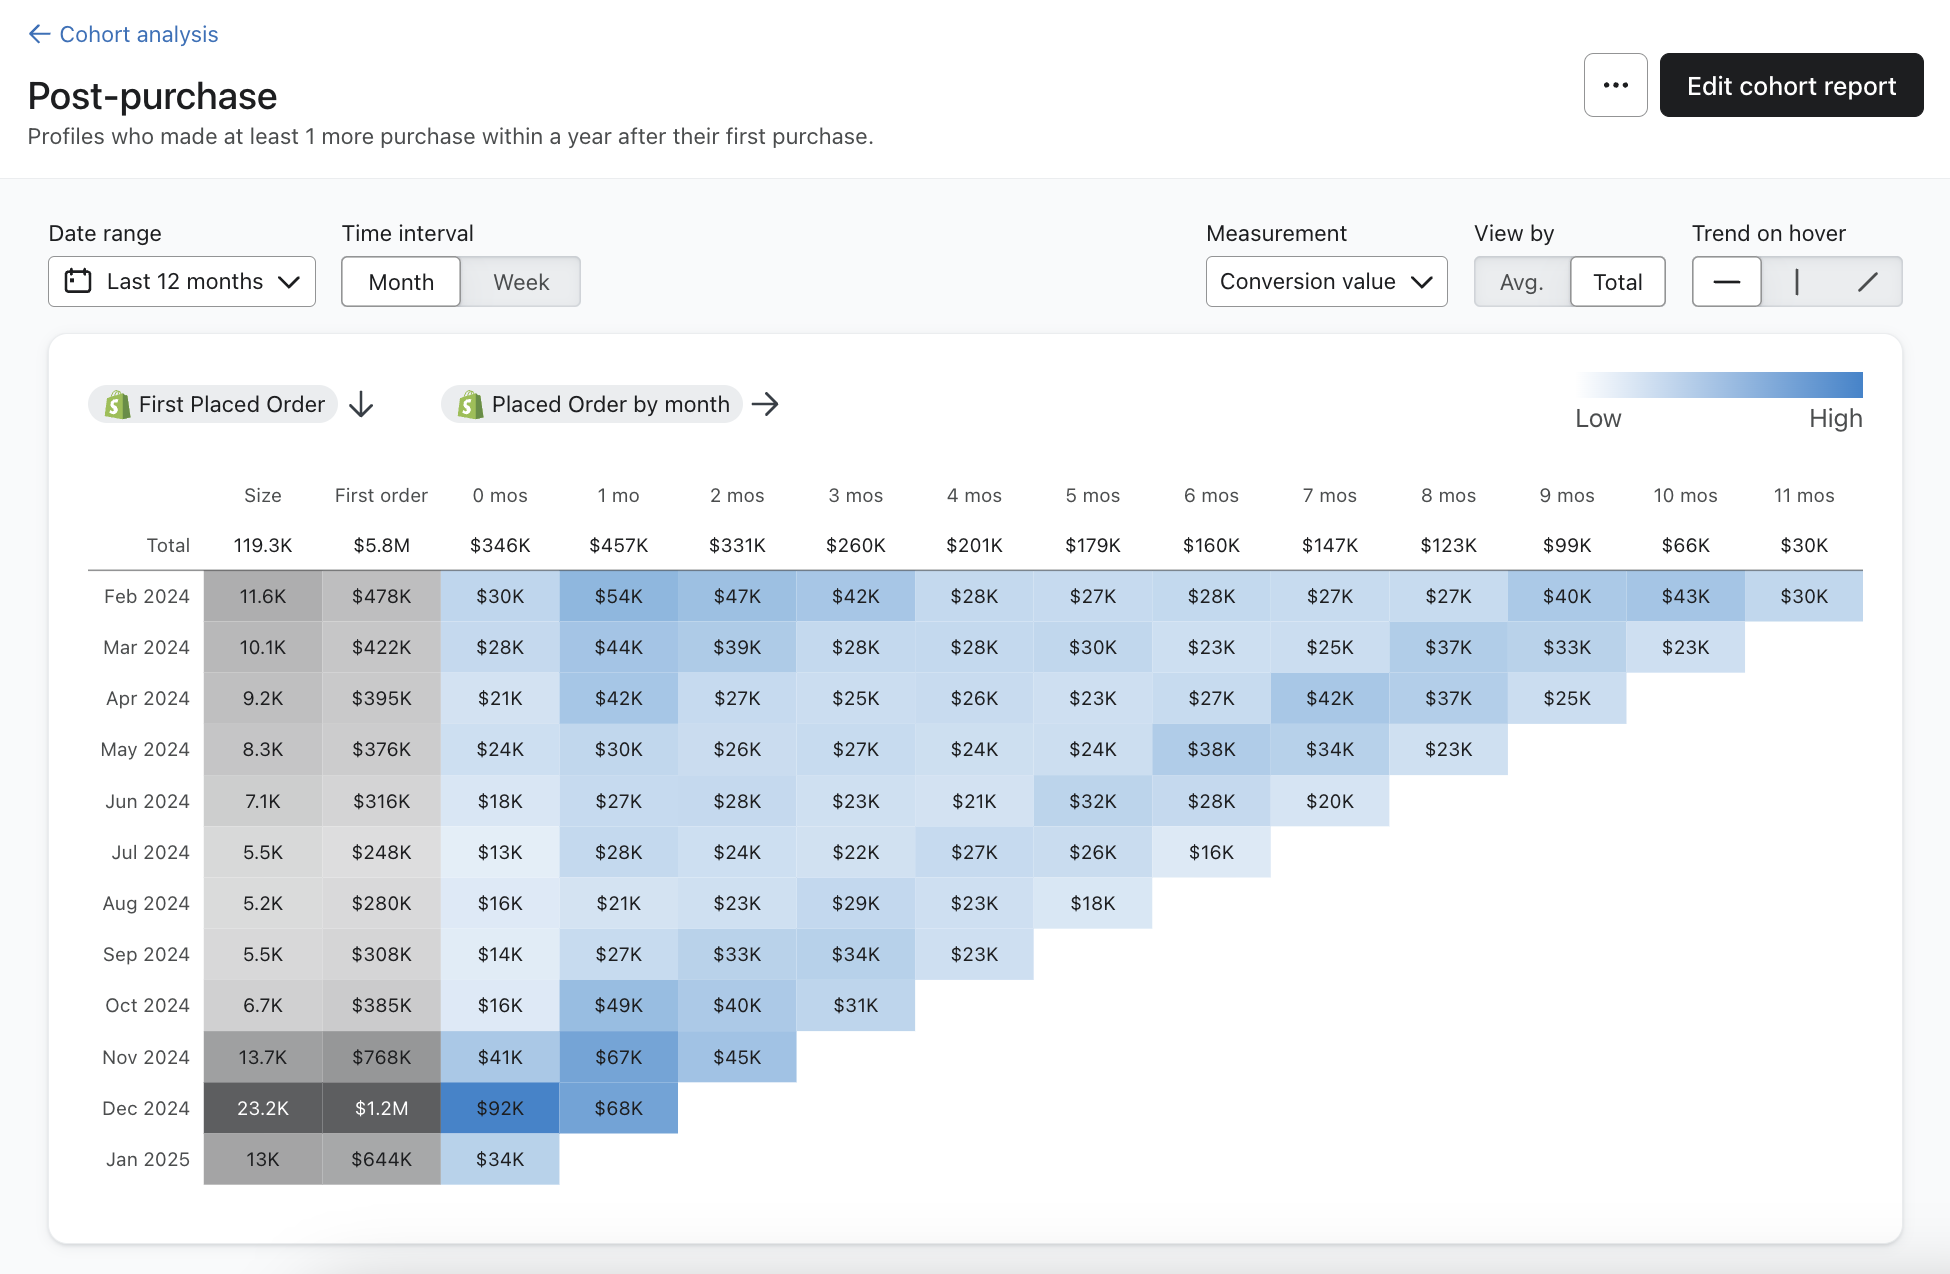
In addition to iterations on existing features, the list of features to develop was growing. Cohort analysis, much like funnel analysis, was previously not very discoverable and was actually incorrect. I partnered with our reporting design lead to design the first iterations of the new cohort report to make it customizable and insightful like the rest of the Intelligence feature set. We then passed it to another team member who iterated further and saw it through development.
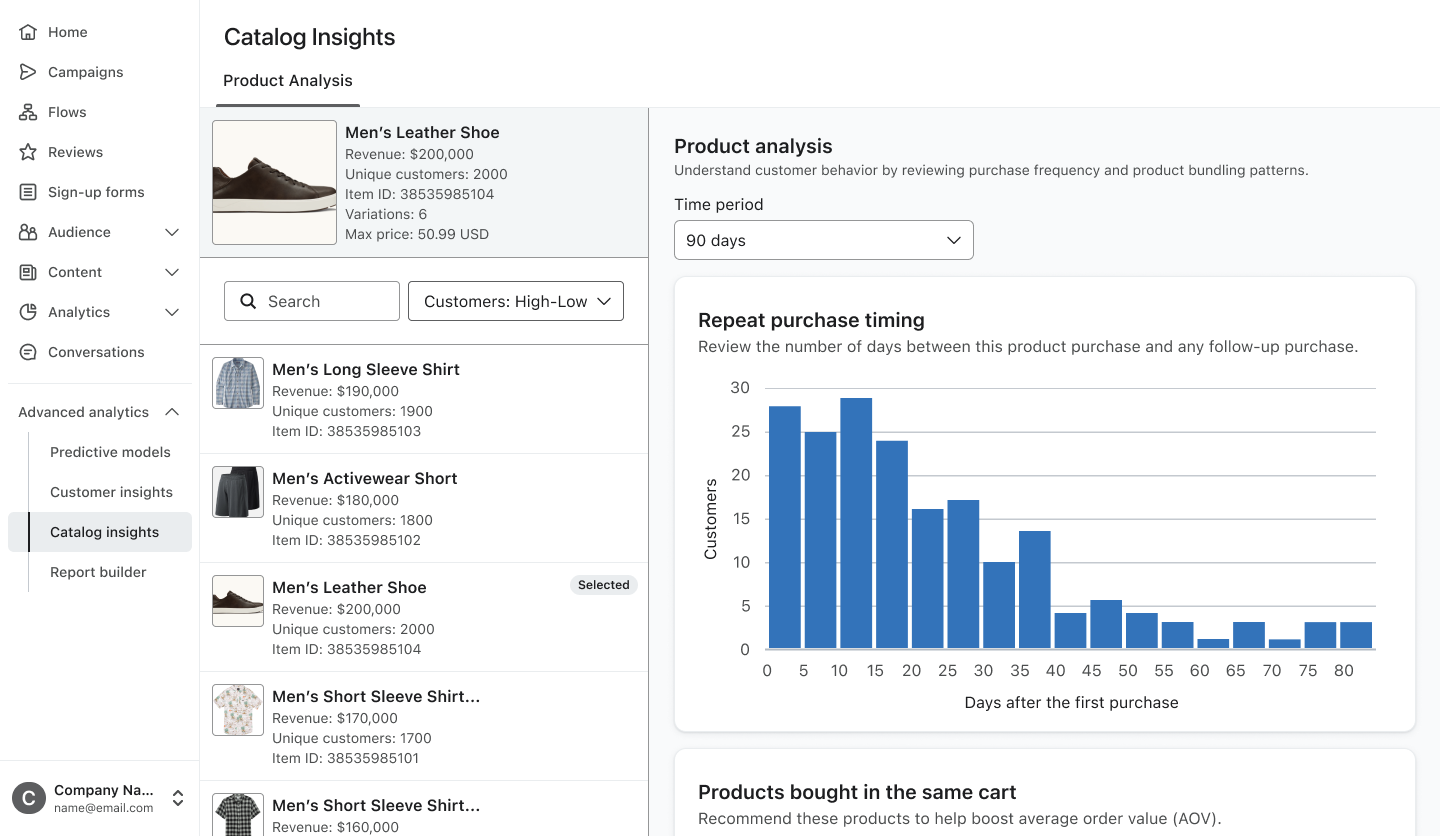
I was also tasked with the launch of Product Analysis, a tool that allowed customers to view repeat purchase timing, co-purchase rates, and subsequent purchase rates across products in their catalog. A feature that was highly desired by customers.
The sales team was leveraging this particular set of features to sell the wider CDP product, leading to this 0-1 product reaching revenue targets for its first year and beyond. The potential for this set of expanding features to sell to a broader and more down-market Klaviyo and bring even more revenue to the company led to the launch of Marketing Analytics, its own standalone product that since release has exceeded revenue targets over multiple months.